From Clicks to Context: How Using Data Strategically Shapes the Sports Narrative
Data points are just numbers until they become part of an overall story
Data is everywhere in sports. It shapes analysis, enhances fan engagement, and provides teams with deeper insights. The way it is presented, however, varies across platforms. A well-placed stat on a broadcast can create instant drama, while a deep dive on a podcast can shift the way fans think about a team or player.
Sports media isn’t just about reporting what happened. It’s about crafting a story that resonates with its audience. Typically, storytelling in sports focuses on player performance—win-loss records, shooting percentages, or clutch stats—but there’s a much broader world of data that could be leveraged to tell deeper, more engaging stories.
Where fans are watching from, how different markets support certain teams, and the ways fan behaviors shift based on geography, time zones, or cultural differences are often alluded to in a qualitative way. Broadcasters and analysts frequently mention “big-market teams” or the “die-hard fanbases” of certain regions, yet these narratives often rely on generalizations rather than hard data. There’s an opportunity to use real insights to build richer, more nuanced stories about the way sports exist beyond the field.
Social Media: The Headline-Driven Approach
Short attention spans define social platforms. Data here needs to be immediate, digestible, and visually engaging. A well-timed stat, whether in a tweet, an Instagram story, or a TikTok clip, can spark debates and drive fan engagement in seconds.
Performance stats tend to dominate these platforms, but fan data could be just as compelling. Imagine a heat map of where viewers are tuning in for a major game or an interactive breakdown of how different cities support rival teams. A simple “Top 5 Cities Watching Tonight’s Game” post could give fans a sense of community while reinforcing regional rivalries. These insights are often available but underutilized in mainstream social media storytelling.
Broadcasts: Enhancing the Live Moment
Live sports move fast. Data needs to be contextual and immediate. A graphic on screen showing a pitcher’s performance against left-handed hitters adds layers to an at-bat. Win probability shifts create real-time tension. When used well, stats elevate the experience, giving fans a deeper appreciation of the action unfolding in front of them.
Beyond performance, there’s room to showcase broader trends. Networks often allude to strong regional fan bases—"this team travels well," or "they have a huge following across the country"—but rarely support these claims with hard numbers. Imagine a visual showing how ticket resale prices surge when a team with a national fanbase plays on the road or a live map highlighting spikes in viewership across different cities. These data points would validate existing narratives while providing fresh angles for discussion.
Podcasts: The Deep Dive
Podcasts allow for long-form storytelling where data isn’t just a supporting piece—it can drive the entire narrative. A discussion on how home-field advantage has declined over the past decade works well in this format because there’s time to break down trends, explore theories, and challenge assumptions.
Beyond player stats, fan behavior data could create fascinating discussions. Why do some teams have larger national followings than others? What factors influence attendance patterns beyond just performance? A deep dive into why one market consistently overperforms in jersey sales or why international audiences gravitate toward specific teams could provide unique angles that aren’t explored in quick-hit media formats.
Long-Form Journalism: Context Over Clicks
Written storytelling allows for a level of depth that other platforms struggle to match. Here, data can be layered into a broader narrative, providing evidence without feeling forced. A feature on an aging superstar’s decline isn’t just about a drop in shooting percentage—it’s about the evolution of their game, the physical toll, and how their impact is changing.
The same principle applies to fan data. Markets are often painted in broad strokes—"New York is a basketball city" or "Texas loves its football"—but real data can reveal deeper truths. A story about the NFL’s growing popularity in non-traditional markets like Germany or Mexico could be supported by viewership trends, merchandise sales, and travel data from fans attending games abroad. These insights would move beyond assumptions and create more compelling, evidence-based narratives.
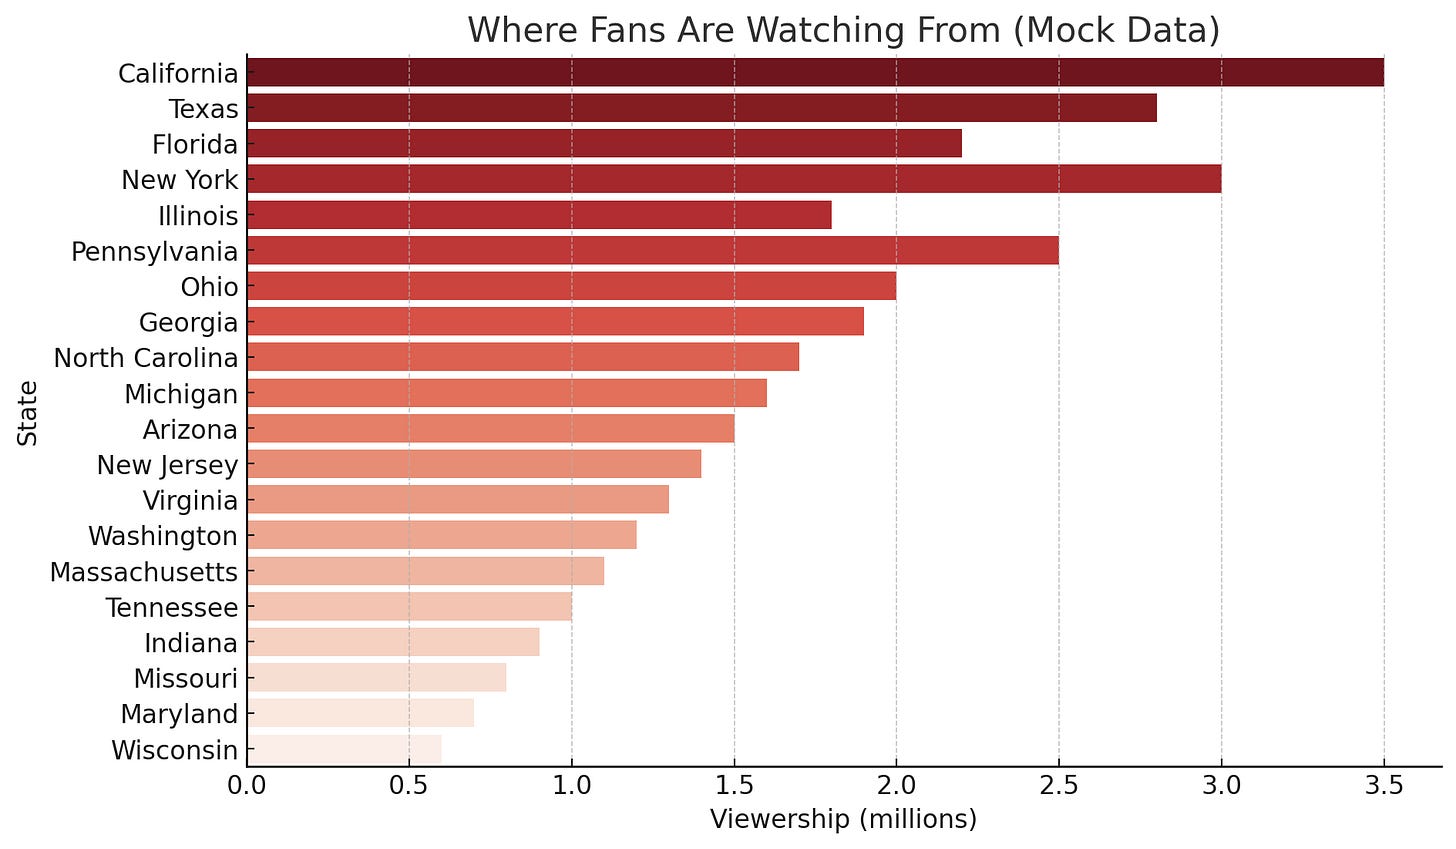
For example, taking this graph below into a visually compelling map would be a great way to integrate this type of data into longer form content. Right now, it’s a poorly designed, developed, and flat data point.
Where Data Meets Storytelling
Each platform plays a different role in shaping how fans consume data. Social media provides quick hits that fuel conversation. Broadcasts enhance the live experience. Podcasts allow for analysis and debate. Long-form journalism builds narratives that stand the test of time.
Most of the time, data storytelling in sports revolves around performance, but there’s an opportunity to expand the conversation. Fan engagement, viewership trends, and regional support are often discussed in vague terms or by business outlets, yet the data exists to make these stories richer and more accurate.
Using stats to quantify fandom, viewership shifts, and market trends would bring new dimensions to sports storytelling. The best data storytelling adapts to the medium while keeping the core goal the same—turning numbers into something fans care about. As always, thanks for reading.


